Press Releases

02-07-2020 12:58
Results of the Services and Transport Survey 2018
According to the results of the Services and Transport Survey, the tertiary sector of the economy registered in 2018 a positive growth rate compared to 2017.
In particular, production value showed an increase of 6,8% in transportation and storage (sector H), 6,6% in accommodation and food service activities (sector I), 8,8% in information and communication (sector J), 16,3% in real estate activities (sector L), 10,4% in professional, scientific and technical activities (sector M) and 16,9% in administrative and support service activities (sector N).
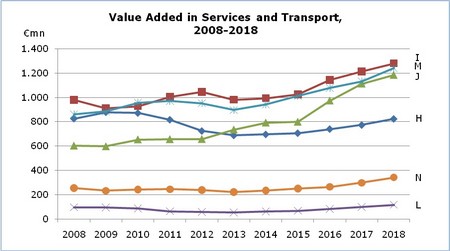
Similarly, value added at current prices also recorded a rise. An increase of 6,6% to €823,8 million was observed in transportation and storage, 5,6% to €1.280,3 million in accommodation and food service activities, 6,5% to €1.183,9 million in information and communication, 16,7% to €117,2 million in real estate activities, 9,7% to €1.242,6 million in professional, scientific and technical activities and 14,7% to €342,3 million in administrative and support service activities.

Furthermore, the number of persons engaged also exhibited an increase. Employment in transportation and storage reached 19.374 persons recording an increase of 6,0%, in accommodation and food service activities 48.462 (+9,0%), in information and communication 12.097 (+14,3%), in real estate activities 2.561 (+15,5%), in professional, scientific and technical activities 29.401 (+9,8%) and in administrative and support service activities 12.977 persons (+10,4%).
|
Table |
|||||||
|
NACERev.2 |
Economic Activity |
Production Value |
Value Added at Current Prices |
Employment |
|||
|
€mn |
%* |
€mn |
%* |
Number |
%* |
||
|
H |
Transportation and Storage |
3.142,4 |
6,8 |
823,8 |
6,6 |
19.374 |
6,0 |
|
I |
Accommodation and Food Service Activities |
2.520,9 |
6,6 |
1.280,3 |
5,6 |
48.462 |
9,0 |
|
J |
Information and Communication |
3.529,0 |
8,8 |
1.183,9 |
6,5 |
12.097 |
14,3 |
|
L |
Real Estate Activities |
181,4 |
16,3 |
117,2 |
16,7 |
2.561 |
15,5 |
|
M |
Professional, Scientific and Technical Activities |
2.197,1 |
10,4 |
1.242,6 |
9,7 |
29.401 |
9,8 |
|
N |
Administrative and Support Service Activities |
574,3 |
16,9 |
342,3 |
14,7 |
12.977 |
10,4 |
* Annual percentage change of 2018 compared to 2017.
METHODOLOGICAL INFORMATION
Definitions
Employment – The average number of all persons employed during the year, in full time equivalent terms.
Production value –The value of services produced, net receipts from the sale of goods sold in the same condition as purchased and other income.
Value added at current prices – Derived by deducting from the production value the production expenses as well as the administrative expenses and rents paid for buildings and machinery.
Coverage and collection of data
The Services and Transport Survey is carried out on an annual basis and covers enterprises with the main activity falling under sections H (Transportation and storage), I (Accommodation and food service activities), J (Information and communication), L (Real estate activities), M (Professional, scientific and technical activities) and N (Administrative and support service activities) of the classification system of economic activities NACE Rev. 2 of the European Union.
The Survey for 2018 covered a sample of around 2.410 enterprises. The collection of data by the Statistical Service was done by personal interview with the use of a special questionnaire.
For more information:
Statistical Service (CYSTAT) Website, subthemes Other Services, Transport and Communications
Contact
Margarita Georgiou: Tel: +35722602217, Email: mgeorgiou@cystat.mof.gov.cy
Kalomyra Frangou: Tel: +35722602220, Email: kfrangou@cystat.mof.gov.cy
(EH/II)
Relevant Press Releases

19-04-2024 16:42
PIO e-mail Αlerts service is suspended

18-04-2024 14:04
Price Index of Construction Materials: March 2024

17-04-2024 13:26
Harmonised Index of Consumer Prices (HICP): March 2024


