Press Releases
30-06-2021 13:58
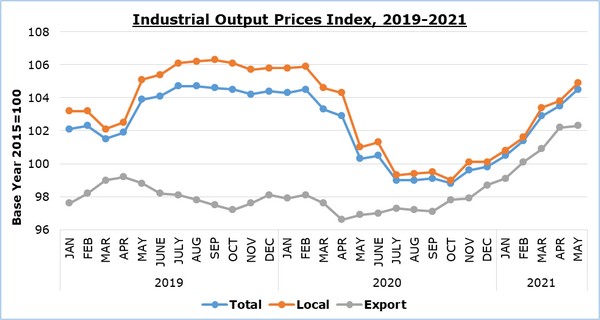
Index of Industrial Output Prices: May 2021 (Annual Change +4,2%)
The Index of Industrial Output Prices for May 2021 reached 104,5 units (base 2015=100), recording an increase of 1,0% compared to April 2021. Compared to the corresponding month of the previous year, the index recorded an increase of 4,2%. For the period January-May 2021, the index showed a decrease of 0,5% compared to the corresponding period of 2020.
In May 2021 compared to April 2021, the index remained stable in the sector of mining and quarrying, while it showed a rise in the sectors of manufacturing by 0,7%, electricity supply by 1,5% and water supply and materials recovery by 3,5%.
Compared to the corresponding month of the previous year, an increase was recorded in all sectors, as follows: water supply and materials recovery 29,7%, electricity supply 5,0%, manufacturing 2,6% and mining and quarrying 0,7%.
By division of economic activity in manufacturing, in May 2021 compared to the corresponding month of the previous year, increases were recorded in the manufacture of basic metals and fabricated metal products (9,3%), the manufacture of wood and products of wood and cork, except furniture (8,3%), the manufacture of food products, beverages and tobacco products (2,5%), the manufacture of rubber and plastic products (2,0%) and the manufacture of other non-metallic mineral products (1,6%), while decreases were recorded in the manufacture of refined petroleum products, chemicals and chemical products and pharmaceutical products and preparations (-0,3%) and the manufacture of textiles, wearing apparel and leather products (-0,5%).
Table 1
|
Economic Activity |
Index (2015=100) |
Percentage Change (%) |
|||
|
Apr 2021 |
May 2021 |
May 2021/ Apr 2021 |
May 2021/ May 2020 |
Jan-May 2021/ Jan-May 2020 |
|
|
Mining and Quarrying |
98,9 |
98,9 |
0,0 |
0,7 |
0,3 |
|
Manufacturing |
102,9 |
103,6 |
0,7 |
2,6 |
0,5 |
|
Electricity Supply |
103,4 |
104,9 |
1,5 |
5,0 |
-8,3 |
|
Water Supply and Materials Recovery |
115,4 |
119,4 |
3,5 |
29,7 |
19,7 |
|
General Index Local Export |
103,5 103,8 102,2 |
104,5 104,9 102,3 |
1,0 1,1 0,1 |
4,2 3,9 5,6 |
-0,5 -1,4 3,6 |
Note: Data for April 2021 in the sector of Water Supply and Materials Recovery and May 2021 in the sectors of Electricity Supply and Water Supply and Materials Recovery are preliminary.
Table 2
|
Code NACE Rev. 2 |
Economic Activity |
Percentage Change (%) |
||
|
May 2021/ Apr 2021 |
May 2021/ May 2020 |
Jan-May 2021/ Jan-May 2020 |
||
|
C |
ΜANUFACTURING |
0,7 |
2,6 |
0,5 |
|
10+11+12 |
Manufacture of Food Products, Beverages and Tobacco Products |
0,5 |
2,5 |
-0,6 |
|
13+14+15 |
Manufacture of Textiles, Wearing Apparel and Leather Products |
0,0 |
-0,5 |
-0,4 |
|
16 |
Manufacture of Wood and Products of Wood and Cork, except Furniture |
4,7 |
8,3 |
3,4 |
|
17+18 |
Manufacture of Paper and Paper Products and Printing |
0,0 |
0,5 |
0,5 |
|
19+20+21 |
Manufacture of Refined Petroleum Products, Chemicals and Chemical Products and Pharmaceutical Products and Preparations |
0,0 |
-0,3 |
-0,2 |
|
22 |
Manufacture of Rubber and Plastic Products |
1,6 |
2,0 |
0,3 |
|
23 |
Manufacture of Other Non-Metallic Mineral Products |
-2,0 |
1,6 |
1,4 |
|
24+25 |
Manufacture of Basic Metals and Fabricated Metal Products |
3,3 |
9,3 |
5,4 |
|
26+27 |
Manufacture of Electronic and Optical Products and Electrical Equipment |
1,7 |
0,9 |
-0,5 |
|
28+29+30 |
Manufacture of Machinery and Equipment, Motor Vehicles and Other Transport Equipment |
0,0 |
0,6 |
0,4 |
|
31+32+33 |
Manufacture of Furniture, Other Manufacturing and Repair and Installation of Machinery and Equipment |
0,3 |
0,7 |
0,7 |
METHODOLOGICAL INFORMATION
Definitions
The Industrial Output Prices Index is a monthly index and is the combination of the Industrial Output Prices Index for the domestic market and the Industrial Output Prices Index for the non domestic market.
The prices collected for products sold in the domestic market are basic selling prices excluding VAT, discounts, commissions and excise duties. Moreover, the prices collected for products sold in the non domestic market are quoted FOB (free on board).
The prices collected refer mainly to transactions between the enterprises that produce and sell the products chosen for the compilation of the Industrial Output Prices Index and the enterprises that buy these products, regardless of whether those products are to be used as raw materials or as merchandise.
Scope
The monthly Industrial Output Prices Index reflects the evolution of prices in the sectors of mining and quarrying, manufacturing, electricity supply, water supply and materials recovery, that is, sections B, C, D and E of the statistical classification of economic activities NACE Rev. 2 of the European Union. The index does not include sewerage, waste collection, treatment and disposal and remediation activities, which are codes 37, 38.1, 38.2 and 39 of section E. The index can be an early indicator of inflationary pressures in the economy. The aggregated index is broken down to local market and export market indices.
Data collection
The collection of data for the sectors of mining and quarrying, manufacturing and materials recovery is conducted by the Statistical Service by telephone enquiries and e-mail. Data is collected after the first Thursday of each month from a sample of enterprises. The Electricity Authority of Cyprus provides consumption data in quantity and value terms, while data is also received from water distribution and desalination units.
Compilation method
The Industrial Output Prices Index is using 2015 as base year, meaning that it shows the monthly changes in prices in relation with the monthly average prices of the year 2015. In the base year, the average of the price indices for the twelve months is 100,0. For example, a monthly price index of 112,3 means that the prices for the specific month have increased by 12,3% in relation to the average monthly prices of 2015.
The aggregated Industrial Output Prices Index is a weighted average of the price indices of the various sub-sectors of Industry. The weights used reflect the sales value of products belonging to each sub-sector in the base year (2015) in relation to the total sales value of the sector.
The compilation of the Industrial Output Prices Index follows the provisions of Council Regulation (EC) No 1165/98 concerning short-term statistics. The Index is transmitted every month to the Statistical Office of the European Union (Eurostat).
For more information:
Statistical Service (CYSTAT) Website, subtheme Industry
Contact
Evangelia Menelaou: Tel.: 22602165, E-mail: emenelaou@cystat.mof.gov.cy
(MV/SCH)
Relevant Press Releases
18-04-2024 14:04
Price Index of Construction Materials: March 2024
17-04-2024 13:26
Harmonised Index of Consumer Prices (HICP): March 2024

12-04-2024 13:33
Monthly Economic Indicators: January–February 2024