Press Releases
17-10-2018 12:32
Harmonized Index of Consumer Prices: September 2018
Annual rate of change: 1,7%
The Harmonized Price Index (HICP)for September 2018 increased by 1,7% when compared to September 2017, while compared to August of 2018 decreased by 0,8%. For the period January-September 2018 the HICP increased by 0,5% compared to the corresponding period of the previous year. (Table 1)
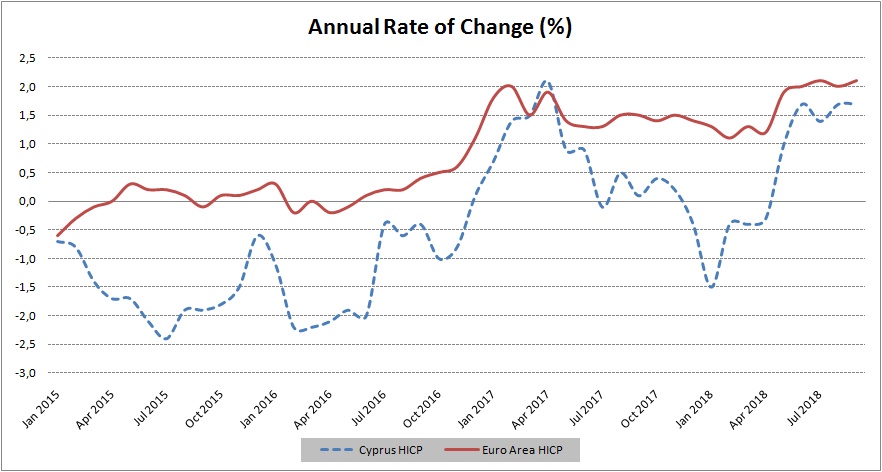
Note: The HICP in Euro area for the last month is based on EUROSTAT estimation (flash estimate).
Compared to the index of September 2017, the largest change was noted in Housing, Water, Electricity, Gas and Other Fuels with a percentage of 12,8%. (Table 1)
In comparison to HICP of August 2018, the largest positive change was recorded in Clothing and Footwear (10,9%) while the biggest negative change was noted in Transport (-7,4%). (Table 1)
For the period January - September 2018, compared to the corresponding period of the previous year, the largest positive change was noted in Housing, Water, Electricity, Gas and Other Fuels (3,3%) while the largest negative change was observed in Furnishings, Household Equipment and Routine Maintenance of the House (-3%). (Table 1)
As regards to the economic origin, the largest change when compared to the index of September 2017 was observed in Energy with a percentage of 16,3%. In comparison to the index of the previous month, the biggest change was noticed in Services (-3,4%). (Table 2)
|
Table 1 |
|||||
|
Categories of Goods and Services |
HICP(2015=100) |
Change (%) |
|||
|
Aug 2018 |
Sep 2018 |
Sep18 /Sep17 |
Sep 18 / Aug 18 |
Jan-Sep 18 / Jan-Sep17 |
|
|
Food and Non-Alcoholic Beverages |
103,72 |
103,62 |
3,9 |
-0,1 |
0,7 |
|
Alcoholic Beverages, Tobacco |
96,60 |
96,64 |
-2,3 |
0,0 |
-1,6 |
|
Clothing and Footwear |
87,64 |
97,22 |
-0,4 |
10,9 |
-2,7 |
|
Housing, Water, Electricity, Gas and Other Fuels |
106,05 |
109,45 |
12,8 |
3,2 |
3,3 |
|
Furnishings, Household Equipment and Routine Maintenance of the House |
93,18 |
94,82 |
-2,2 |
1,8 |
-3,0 |
|
Health |
102,07 |
102,07 |
-0,3 |
0,0 |
0,3 |
|
Transport |
104,97 |
97,25 |
2,9 |
-7,4 |
3,2 |
|
Communication |
96,90 |
92,22 |
-5,4 |
-4,8 |
-1,2 |
|
Recreation and Culture |
100,66 |
99,87 |
2,0 |
-0,8 |
-0,8 |
|
Education |
101,89 |
103,36 |
2,1 |
1,4 |
1,2 |
|
Restaurants and Hotels |
112,09 |
110,14 |
0,2 |
-1,7 |
1,3 |
|
Miscellaneous Goods and Services |
98,37 |
100,24 |
0,5 |
1,9 |
-0,4 |
|
General Harmonised Consumer Price Index |
102,91 |
102,11 |
1,7 |
-0,8 |
0,5 |
|
Table 2 |
||||
|
Economic Origin |
Weights |
Change (%) |
||
|
Sep18 / Sep 17 |
Sep 18 / Aug 18 |
|||
|
General HICP |
1000 |
1,7 |
-0,8 |
|
|
Energy |
84,01 |
16,3 |
2,8 |
|
|
Food-Alcoholic Beverages-Tobacco |
236,04 |
2,2 |
-0,1 |
|
|
Non Energy Industrial Goods |
219,83 |
-1,3 |
3,1 |
|
|
Services |
460,13 |
0,4 |
-3,4 |
|
|
Note: The weights of the categories are calculated with infinite decimal figures and rounded up to two decimals when published. Figures do not add up to the total due to rounding. |
||||
Methodological notes
Definitions
The Harmonized Price Index (HICP) an economic indicator constructed to measure the changes of prices over time of consumer goods and services acquired, used or paid by households and tourists within the economic territory of the country. The HICP is calculated according to a harmonized approach and methodology laid down by a series of regulations of EU.
The Annual change shows the change of the HICP when compared with the index of the corresponding month of the previous year.
Products/Services
From January 2018 and onwards, the products included in the HICP have been revised. The revision was based on the results of the Household Budget Survey 2015/2016.
Collection
The price collection is carried out only in urban districts of Nicosia, Larnaca, Limassol and Paphos. For each city, the fluctuations in the product prices each month are weighted according to their population. Specifically, the weights for the four districts are: Lefkosia 42%, Lemesos 30%, Larnaka 18% and Pafos 10%.
The prices of 805 goods and services are recorded once every month, except for some seasonal products (e.g vegetables and fruits), meat and fuels, whose prices are collected every week (every Thursday). The collected prices are those actually paid by consumers for the purchase of specific goods and services, and they include various taxes, such as the Value Added Tax and excise duties. For the calculation of the Index end-of-season sales prices are taken into account as well as special offer prices which are available for the general public and have no restrictions.
Weights
The weight of the HICP goods and services are calculated based on consumption expenditure (of both households and tourists) incurred in the economic territory of the country. Up to 2011, the main source for the consumption expenditures was the Household Budget Survey, while from 2012 and onwards, data from the National Accounts are utilized satisfying relevant Eurostat’s Regulation (No 1114/2010).
Base year
The index reference period was 2005=100 for the period between January 2006 and December 2015. From January 2016 and onwards, the base year is 2015=100.
Classification
Until December 2015, COICOP 4 classification was used for the calculation and the dissemination of the HICP. From January 2016 and onwards, CYSTAT is adopting the ECOICOP classification satisfying relevant Eurostat’s Regulation. In other words, the lowest level of detail for the classification used in CPI is COICOP 5-digits.
Further information:
Statistical Service (CYSTAT) Website, subtheme Harmonized Index of Consumer Prices
Contact
Constandia Papageorgiou: Tel: +35722602116, Email: cpapageorgiou@cystat.mof.gov.cy
Andri Eftychiou: Τel: +35725878595, Email: aeftychiou@cystat.mof.gov.cy
(AH)
Relevant Press Releases
19-04-2024 16:42
PIO e-mail Αlerts service is suspended
18-04-2024 14:04
Price Index of Construction Materials: March 2024
17-04-2024 13:26
Harmonised Index of Consumer Prices (HICP): March 2024