Press Releases
07-02-2019 12:42
Consumer Price Index: January 2019
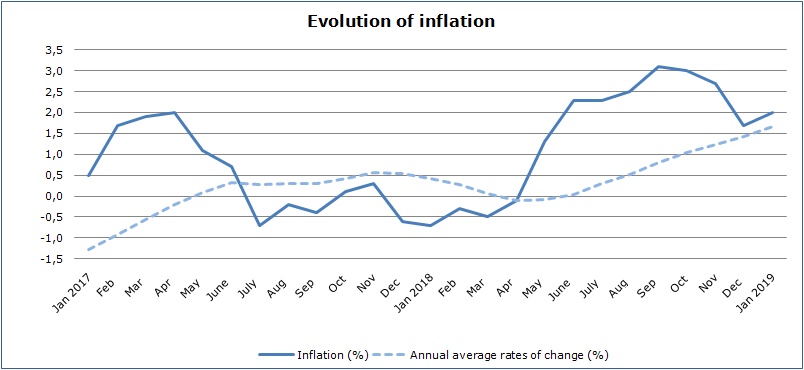
Inflation 2,0%
In January 2019, the Consumer Price Index (CPI) decreased by 0,95 units and reached 99,76 units compared to 100,71 units in December 2018. Compared to January 2018, the CPI increased by 2,0%. (Table 1)
In the twelve-month period from February 2018 to January 2019, in comparison to the period from February 2017 to January 2018, the annual average rate of change of the CPI was 1,7%. The corresponding annual average rate of change of the CPI in the previous twelve month period was 0,4%.
As regards the economic origin, when compared to the index of January 2018 the largest change was recorded in Electricity with an increase of 34,9%, while in comparison to the index of the previous month, the largest change was noted in Agricultural goods with a change of 10,4%. (Table 2)
Analysis of changes
Compared to January 2018, the category Housing, Water, Electricity, Gas and Other Fuels recorded the largest positive change with a percentage of 10%. (Table 1)
In comparison to the CPI of December 2018, the largest negative change was noted in Clothing and Footwear (-16,9%). (Table 1)
Analysis of effects
The categories with the largest positive effect on the change of the CPI of January 2019 when compared to January 2018 were the following: Food and Non-Alcoholic Beverages (1,28 units) and Housing, Water, Electricity, Gas and Other Fuels (1,11 units). (Table 3)
The category with the largest negative effect on the change of the CPI compared to the previous month, was the Clothing and Footwear (-1,29 units) while Food and Non-Alcoholic Beverages had the highest positive effect (0,89 units). (Table 3)
The following products/services had the most notable positive effect on the change of the CPI of January 2019 compared to January 2018: fresh vegetables (1,07 units) and electricity (1,02 units), while petroleum products had the largest negative effect (-0,80 units). (Table 4)
Finally, the products with the most negative effect on the change of the CPI of January 2019 compared to the previous month were the following: clothing (-0,94 units) and petroleum products (-0,56 units). On the other hand, fresh vegetables had the largest positive effect (0,60 units). (Table 5)
|
Table 1 |
||||
|
Categories of Goods and Services |
CPI (2015=100) |
Change (%) |
||
|
December 2018 |
January 2019 |
Jan 19/ Jan 18 |
Jan 19/ Dec 18 |
|
|
Food and Non-Alcoholic Beverages |
98,50 |
103,18 |
6,99 |
4,75 |
|
Alcoholic Beverages and Tobacco |
97,43 |
97,91 |
0,11 |
0,49 |
|
Clothing and Footwear |
106,17 |
88,22 |
1,19 |
-16,91 |
|
Housing, Water, Electricity, Gas and Other Fuels |
110,83 |
109,98 |
9,95 |
-0,77 |
|
Furnishings, Household Equipment and Routine Maintenance of the House |
96,04 |
95,16 |
-1,36 |
-0,92 |
|
Health |
101,85 |
102,12 |
0,13 |
0,27 |
|
Transport |
96,52 |
93,52 |
-4,04 |
-3,11 |
|
Communication |
92,27 |
92,19 |
-5,36 |
-0,09 |
|
Recreation and Culture |
99,69 |
99,65 |
-0,09 |
-0,04 |
|
Education |
105,01 |
105,01 |
1,86 |
0,00 |
|
Restaurants and Hotels |
103,54 |
103,45 |
2,35 |
-0,09 |
|
Miscellaneous Goods and Services |
99,57 |
100,00 |
1,19 |
0,43 |
|
General Consumer Price Index |
100,71 |
99,76 |
1,98 |
-0,94 |
|
Table 2 |
|||
|
Economic Origin |
Weights |
Change (%) |
|
|
Jan 19 / Jan 18 |
Jan 19 / Dec 18 |
||
|
General Index |
10000 |
1,98 |
-0,94 |
|
Agricultural goods |
655 |
20,83 |
10,40 |
|
Industrial goods (excl. petroleum products) |
4195 |
-0,71 |
-3,03 |
|
Electricity |
319 |
34,87 |
-1,17 |
|
Petroleum products |
550 |
-9,81 |
-6,69 |
|
Water |
57 |
-2,78 |
0,00 |
|
Services |
4224 |
1,63 |
0,20 |
|
Table 3 |
|||
|
Categories of Goods and Services |
Weights |
Effect (units) |
|
|
Jan 19 / Jan 18 |
Jan 19 / Dec 18 |
||
|
Food and non-alcoholic beverages |
1906 |
1,28 |
0,89 |
|
Alcoholic beverages, tobacco |
347 |
0,00 |
0,02 |
|
Clothing and footwear |
721 |
0,07 |
-1,29 |
|
Housing, water, electricity, gas and other fuels |
1119 |
1,11 |
-0,10 |
|
Furnishings, household equipment and routine maintenance of the house |
644 |
-0,08 |
-0,06 |
|
Health |
637 |
0,01 |
0,02 |
|
Transport |
1524 |
-0,60 |
-0,46 |
|
Communication |
439 |
-0,23 |
0,00 |
|
Recreation and culture |
575 |
-0,01 |
0,00 |
|
Education |
392 |
0,08 |
0,00 |
|
Restaurants and hotels |
836 |
0,20 |
-0,01 |
|
Miscellaneous goods and services |
860 |
0,10 |
0,04 |
|
General Consumer Price Index |
10000 |
1,94 |
-0,95 |
Note: Totals are calculated on the basis of the effects of the categories with infinite decimal figures and rounded up to two decimals when published. Figures may not add to totals due to rounding error.
|
Table 4 |
|
|
Goods/Services |
Effect (units) |
|
Jan 19 / Jan 18 |
|
|
Positive effect |
|
|
Fresh vegetables |
1,07 |
|
Electricity |
1,02 |
|
Potatoes |
0,27 |
|
Other goods and services |
0,38 |
|
Negative effect |
|
|
Petroleum products |
-0,80 |
|
TOTAL |
1,94 |
|
Table5 |
|
|
Goods/Services |
Effect (units) |
|
Jan 19 / Dec 18 |
|
|
Positive effect |
|
|
Fresh vegetables |
0,60 |
|
Fresh fruits |
0,11 |
|
Other goods and services |
0,19 |
|
Negative effect |
|
|
Clothing |
-0,94 |
|
Petroleum products |
-0,56 |
|
Footwear |
-0,35 |
|
TOTAL |
-0,95 |
Methodological notes
Definitions
The Consumer Price Index (CPI) is compiled to measure the changes of prices over time of consumer goods and services acquired, used or paid by households. Specifically, the national CPI of Cyprus covers the consumption expenses of specific goods and services (shopping basket of goods and services), of the resident households and of the households that intend to live in Cyprus for at least one year. CPI is the official index for the estimation of inflation.
The Inflation shows the change of the CPI when compared with the index of the corresponding month of the previous year.
The Effect represents the amount of the overall change in the General Index which is accounted for by any given category.
Collection
The price collection is carried out only in urban districts of Lefkosia, Larnaka, Lemesos and Pafos. For each city, the fluctuations in the product prices each month, are weighted according to their population. Specifically, the weights for the four districts are: Lefkosia 42%, Lemesos 30%, Larnaka 18% and Pafos 10%.
The prices of 805 goods and services are recorded once every month, except for some seasonal products (e.g vegetables and fruits), meat and fuels, whose prices are collected every week (every Thursday).
Base year
The index reference period was 2005=100 for the period between January 2006 and December 2015. From January 2016 and onwards, the base year is 2015=100.
Classification
Until December 2015, COICOP 4 classification was used for the calculation and the dissemination of the CPI. From January 2016 and onwards, CYSTAT is adopting the ECOICOP classification satisfying relevant Eurostat’s Regulation. In other words, the lowest level of detail for the classification used in CPI is COICOP 5-digits.
Products/Services and weights
From January 2018 and onwards, the products included in the CPI as well as their corresponding weights have been revised. The revision was based on the results of the Household Budget Survey 2015/2016.
Further information:
Statistical Service (CYSTAT) Website, subtheme Consumer Price Index
Contact
Constandia Papageorgiou: Tel: +35722602116, Email: cpapageorgiou@cystat.mof.gov.cy
Andri Eftychiou: Τel: +35725878595, Email: aeftychiou@cystat.mof.gov.cy
(AH)
Relevant Press Releases
17-04-2024 13:26
Harmonised Index of Consumer Prices (HICP): March 2024

12-04-2024 13:33
Monthly Economic Indicators: January–February 2024
11-04-2024 12:48
Government Employment by Category: March 2024