Press Releases
27-02-2020 13:17
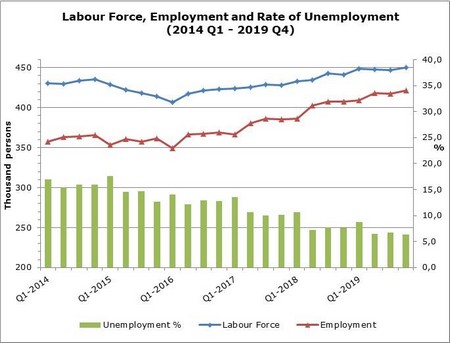
Labour Force Survey (LFS): 4th quarter 2019, unemployment 6,3%
According to the results of the Labour Force Survey, the labour force in the 4th quarter of 2019 amounted to 449.784 persons or 62,9% of the population (males 68,8%, females 57,6%) in comparison to 440.765 persons (62,5%) in the corresponding quarter of 2018 (Table 1).
The number of employed persons was 421.303 and the employment rate 59,0% (males 64,8%, females 53,5%) in comparison to 407.382 persons (57,8%) in the corresponding quarter of 2018.
The number of unemployed persons amounted to 28.481 and the unemployment rate to 6,3% of the labour force (males 5,8%, females 7,0%) in comparison to 33.383 persons (7,6%) in the corresponding quarter of 2018.
For the whole 2019 the unemployment rate was 7,1% in comparison to 8,4% in 2018.
Employment (Table 2)
For the age group 20-64, the employment rate was 76,0%. The rate for males was 81,7% and for females 70,7%. In the corresponding quarter of 2018 the rate was 74,5% (males 80,2%, females 69,3%). For the age group 55-64 the employment rate was 61,4% in comparison to 61,1% in the corresponding quarter of 2018. According to the distribution of employment by sector, the biggest percentage of employed persons was in Services (78,4%), followed by Manufacturing (18,9%) and Agriculture (2,7%). For the 4th quarter of 2018, the corresponding percentages were: Services 80,8%, Manufacturing 17,1% and Agriculture 2,1%. The share of part-time employment to total employment was 11,1% or 46.610 persons (males 7,3%, females 15,3%). The corresponding rate for the 4th quarter of 2018 was 11,2% (males 8,1%, females 14,6%). 86,5% or 364.233 of the total employed persons were employees, of which 14,1% (51.164 persons) had a temporary job. In the corresponding quarter of 2018 employees accounted for 86,7% of total employment of which 12,5% had a temporary job.
Unemployment (Table 3)
For young persons aged 15-24 years old, the unemployment rate was 16,0% of the labour force of the same age group (males 15,9%, females 16,0%) in comparison to 20,6% (males 25,7%, females 16,0%) in the corresponding quarter of last year. As far as the duration of unemployment is concerned, 50,4% of the total unemployed persons searched for a job for a period of less than 6 months, 19,2% for a period of 6-11 months, whereas a percentage of 30,4% were long-term unemployed. The corresponding rates for the 4th quarter of 2018 were 53,7%, 14,2% and 32,1%.
|
Table 1 |
|
|
|
||
|
|
Number |
|
Percentage (%) |
||
|
4th Quarter2019 |
4th Quarter2018 |
|
4th Quarter2019 |
4th Quarter2018 |
|
|
Labour Force |
|
|
|
|
|
|
Total |
449.784 |
440.765 |
|
62,9 |
62,5 |
|
Males |
236.296 |
232.022 |
|
68,8 |
68,5 |
|
Females |
213.489 |
208.743 |
|
57,6 |
57,0 |
|
|
|
|
|
|
|
|
Employment |
|
|
|
|
|
|
Total |
421.303 |
407.382 |
|
59,0 |
57,8 |
|
Males |
222.707 |
214.604 |
|
64,8 |
63,3 |
|
Females |
198.596 |
192.778 |
|
53,5 |
52,7 |
|
|
|
|
|
|
|
|
Unemployment |
|
|
|
|
|
|
Total |
28.481 |
33.383 |
|
6,3 |
7,6 |
|
Males |
13.589 |
17.418 |
|
5,8 |
7,5 |
|
Females |
14.893 |
15.965 |
|
7,0 |
7,6 |
|
Table 2 |
|
|||||||||||||
|
Employment |
Number |
|
Percentage (%) |
|
||||||||||
|
4th Quarter 2019 |
4th Quarter 2018 |
|
4th Quarter 2019 |
4th Quarter 2018 |
|
|||||||||
|
Tot. |
Male |
Fem. |
Tot. |
Male |
Fem. |
|
Tot. |
Male |
Fem. |
Tot. |
Male |
Fem. |
|
|
|
Age |
|
|
|
|
|
|
|
|
|
|
|
|
|
|
|
15+ |
421.303 |
222.707 |
198.596 |
407.382 |
214.604 |
192.778 |
|
59,0 |
64,8 |
53,5 |
57,8 |
63,3 |
52,7 |
|
|
20–64 |
405.335 |
211.263 |
194.071 |
392.370 |
203.698 |
188.672 |
|
76,0 |
81,7 |
70,7 |
74,5 |
80,2 |
69,3 |
|
|
55–64 |
64.283 |
37.384 |
26.899 |
62.346 |
35.097 |
27.249 |
|
61,4 |
72,9 |
50,4 |
61,1 |
70,4 |
52,1 |
|
|
|
|
|
|
|
|
|
|
|
|
|
|
|
|
|
|
Sector |
|
|
|
|
|
|
|
|
|
|
|
|
|
|
|
Agriculture |
11.516 |
8.369 |
3.147 |
8.619 |
6.267 |
2.352 |
|
2,7 |
3,8 |
1,6 |
2,1 |
2,9 |
1,2 |
|
|
Industry |
79.370 |
64.924 |
14.446 |
69.810 |
56.711 |
13.100 |
|
18,9 |
29,1 |
7,3 |
17,1 |
26,4 |
6,8 |
|
|
Services |
330.417 |
149.415 |
181.003 |
328.953 |
151.628 |
177.328 |
|
78,4 |
67,1 |
91,1 |
80,8 |
70,7 |
92,0 |
|
|
|
|
|
|
|
|
|
|
|
|
|
|
|
|
|
|
|
|
|
|
|
|
|
|
|
|
|
|
|
|
|
|
Full-time |
374.693 |
206.553 |
168.140 |
361.739 |
197.144 |
164.595 |
|
88,9 |
92,7 |
84,7 |
88,8 |
91,9 |
85,4 |
|
|
Part-time |
46.610 |
16.154 |
30.456 |
45.644 |
17.460 |
28.183 |
|
11,1 |
7,3 |
15,3 |
11,2 |
8,1 |
14,6 |
|
|
|
|
|
|
|
|
|
|
|
|
|
|
|
|
|
|
Prof. Status |
|
|
|
|
|
|
|
|
|
|
|
|
|
|
|
Self-employed |
57.070 |
35.755 |
21.315 |
54.381 |
34.893 |
19.488 |
|
13,5 |
16,1 |
10,7 |
13,3 |
16,3 |
10,1 |
|
|
|
|
|
|
|
|
|
|
|
|
|
|
|
|
|
|
Employees |
|
|
|
|
|
|
|
|
|
|
|
|
|
|
|
Total |
364.233 |
186.952 |
177.281 |
353.001 |
179.711 |
173.290 |
|
86,5 |
83,9 |
89,3 |
86,7 |
83,7 |
89,9 |
|
|
Permanent |
313.069 |
169.422 |
143.647 |
309.057 |
163.360 |
145.697 |
|
85,9 |
90,6 |
81,0 |
87,5 |
90,9 |
84,1 |
|
|
Temporary |
51.164 |
17.530 |
33.634 |
43.944 |
16.351 |
27.593 |
|
14,1 |
9,4 |
19,0 |
12,5 |
9,1 |
15,9 |
|
|
Table 3 |
|||||||||||||
|
Unemployment |
Number |
|
Percentage (%) |
||||||||||
|
4th Quarter 2019 |
4th Quarter 2018 |
|
4th Quarter 2019 |
4th Quarter 2018 |
|||||||||
|
Tot. |
Male |
Fem. |
Tot. |
Male |
Fem. |
|
Tot. |
Male |
Fem. |
Tot. |
Male |
Fem. |
|
|
Age |
|
|
|
|
|
|
|
|
|
|
|
|
|
|
15+ |
28.481 |
13.589 |
14.893 |
33.383 |
17.418 |
15.965 |
|
6,3 |
5,8 |
7,0 |
7,6 |
7,5 |
7,6 |
|
15–24 |
5.903 |
2.761 |
3.141 |
8.057 |
4.789 |
3.269 |
|
16,0 |
15,9 |
16,0 |
20,6 |
25,7 |
16,0 |
|
25–64 |
22.578 |
10.828 |
11.752 |
25.080 |
12.442 |
12.638 |
|
5,6 |
5,2 |
6,2 |
6,4 |
6,1 |
6,8 |
|
|
|
|
|
|
|
|
|
|
|
|
|
|
|
|
Duration |
|
|
|
|
|
|
|
|
|
|
|
|
|
|
< 6 μήνες |
14.354 |
7.090 |
7.264 |
17.920 |
9.760 |
8.159 |
|
50,4 |
52,2 |
48,8 |
53,7 |
56,0 |
51,1 |
|
6–11 μήνες |
5.461 |
2.379 |
3.081 |
4.752 |
2.446 |
2.306 |
|
19,2 |
17,5 |
20,7 |
14,2 |
14,1 |
14,4 |
|
12+ μήνες |
8.666 |
4.119 |
4.547 |
10.711 |
5.211 |
5.500 |
|
30,4 |
30,3 |
30,5 |
32,1 |
29,9 |
34,5 |
Note: Figures may not add up to totals due to rounding error.
Methodological information
Survey Identity
The Labour Force survey (LFS) is conducted in all European Union Member States in accordance with Council Regulation 577/98 of the European Union every quarter. The aim of the survey is the collection of data which are useful in the formulation of policy on labour matters (employment, unemployment) and for pursuing and evaluating of the programs that are applied both by the Government and by the European Union.
Coverage and collection of data
The LFS covers a sample of 3.800 households in all districts of Cyprus, which are allocated according to the number of households that reside in urban and rural areas. For comparability of the results, in all Member States, the survey covers the population of private households only. It does not cover persons residing in collective households (i.e. institutions, homes for the aged, hospitals, monasteries etc.), conscripts on compulsory military service, students who study abroad and Cypriots who work abroad.
The collection of data from the Statistical Service is done with personal interviews and the use of portable computers as well as with telephone interviews.
Definitions
Labour Force / Economically Active Population – The total number of the employed and unemployed persons aged 15 years and over.
Employed - Persons aged 15 years and over who during the reference week worked for at least one hour, as well as persons who had a job but were temporarily absent from work.
Unemployed – Persons aged 15 years and over who comply to the following standards:
-Neither worked nor had a job from which they were temporarily absent during the reference week
-They had actively sought for work, i.e. had taken specific steps during the previous 4 weeks to find work
-They were available to start work within the 2 weeks following the reference week
And or,
-Persons who neither worked nor had a job from which they were temporarily absent, but found a job which will start within a period of at most 3 months
-They were available to start work within the 2 weeks following the reference week
Long-term unemployed – Persons aged 15 years and over who searched for work for a period of 12 months or more.
Inactive – Persons aged 15 years and over who are neither employed nor unemployed.
Labour Force participation rate – The number of persons in the Labour Force for any group expressed as a percentage of the total population in the same group.
Employment rate - The number of employed persons for any group expressed as a percentage of the total population in the same group.
Unemployment rate – The number of unemployed persons of any group expressed as a percentage of the labour force in the same group.
Further information:
Statistical Service (CYSTAT) Website, subthemes Employment and Unemployment
Infographic Employment, Unemployment
Christophoros Michaelides: Τel: +35722602154, Email: cmichaelides@cystat.mof.gov.cy
Eleni Christodoulidou: Tel: +35722602142, Email: echristodoulidou@cystat.mof.gov.cy
(ΝΝ/ΙΙ)
Relevant Press Releases
24-04-2024 13:05
Announcement by the Department of Labour Inspection on dust episode