Press Releases

12-04-2021 13:29
Government Employment by Category: March 2021 (Total Employment: 52.644)
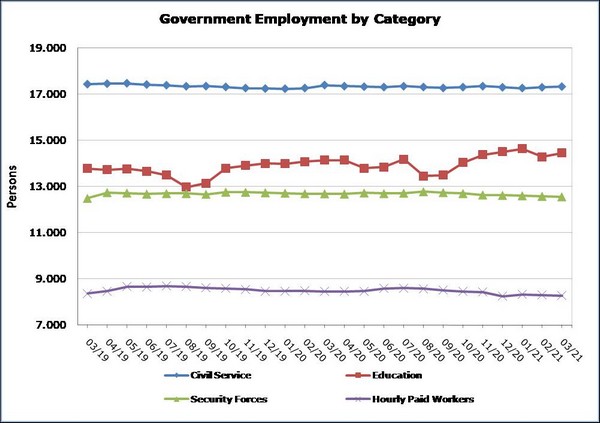
In March 2021 total government employment decreased by 68 persons (-0,1%) in comparison to the corresponding month of 2020 and reached 52.644 persons. Permanent staff decreased by 1.015 persons (-3,7%), from 27.745 to 26.730 persons. Casual staff increased by 1.125 persons (6,8%) and reached 17.631 persons compared to 16.506 persons in March 2020.

Compared to March 2020 an increase is observed in Education staff (2,2%) while a decrease is observed in Civil Service staff (-0,4%) and in Security Forces staff (-1,0%). In all three categories of permanent staff there is a decrease and the highest is observed in Civil Service staff (-4,0%). On the contrary, in all three categories of casual staff there is an increase and the highest is observed in Education staff (15,1%).
Compared to February 2021, an increase is observed in Education staff (1,2%) and in Civil Service staff (0,2%) while a decrease is observed in Security Forces staff (-0,2%). In permanent staff category there is a decrease in Security Forces staff (-0,3%) and in Civil Service staff (-0,2%). In casual staff an increase is observed in Education staff (3,6%) and in Civil Service staff (0,8%) whereas a decrease is observed in Security Forces staff (-0,1%).
|
Table |
|
|
|
|
|
|
|
|
Personnel Category |
|
Number of persons |
|
% Change |
|||
|
|
March 2020 |
February 2021 |
March 2021 |
|
Mar. 21/20 |
Mar.21/ Feb.21 |
|
|
Civil Service |
Total |
17.401 |
17.303 |
17.335 |
|
-0,4% |
0,2% |
|
Permanent |
11.118 |
10.695 |
10.674 |
|
-4,0% |
-0,2% |
|
|
Casual |
6.283 |
6.608 |
6.661 |
|
6,0% |
0,8% |
|
|
Education |
Total |
14.154 |
14.286 |
14.462 |
|
2,2% |
1,2% |
|
Permanent |
9.646 |
9.277 |
9.275 |
|
-3,8% |
0,0% |
|
|
Casual |
4.508 |
5.009 |
5.187 |
|
15,1% |
3,6% |
|
|
Security Forces |
Total |
12.696 |
12.589 |
12.564 |
|
-1,0% |
-0,2% |
|
Permanent |
6.981 |
6.803 |
6.781 |
|
-2,9% |
-0,3% |
|
|
Casual |
5.715 |
5.786 |
5.783 |
|
1,2% |
-0,1% |
|
|
Total |
Total |
44.251 |
44.178 |
44.361 |
|
0,2% |
0,4% |
|
Permanent |
27.745 |
26.775 |
26.730 |
|
-3,7% |
-0,2% |
|
|
Casual |
16.506 |
17.403 |
17.631 |
|
6,8% |
1,3% |
|
|
Hourly Paid Workers |
Total |
8.461 |
8.303 |
8.283 |
|
-2,1% |
-0,2% |
|
Grand Total |
|
52.712 |
52.481 |
52.644 |
|
-0,1% |
0,3% |
Methodological Information
Coverage
Government employment includes Civil Service, Educational Service, Security Forces staff and Hourly Paid Workers. Civil Service includes permanent and casual staff of the Ministries, Departments and Services. Educational Service includes the permanent and casual educational staff of school units and the staff of the Cyprus Productivity Center and the Higher Hotel Institute of Cyprus. Security Forces include Police Service, Fire Service and the National Guard staff. The Hourly Paid workers include regular, casual and seasonal staff. The members of the House of Representatives are not included.
Collection of data
Data concerning Government employment is provided by the Treasury and refers to the number of persons that were paid in the current month.
For more information:
Statistical Service (CYSTAT) Website, subtheme Employment
Contact
George Alex. Georgiou: Tel: +357-22602233, Email: galgeorgiou@cystat.mof.gov.cy
Eleni Christodoulidou: Tel: +357-22602142, Email: echristodoulidou@cystat.mof.gov.cy
(IK/ECHR)
Relevant Press Releases

19-04-2024 16:42
PIO e-mail Αlerts service is suspended

18-04-2024 14:04
Price Index of Construction Materials: March 2024

17-04-2024 13:26
Harmonised Index of Consumer Prices (HICP): March 2024


