Press Releases
18-08-2022 13:55
Poverty and Social Exclusion: 2021
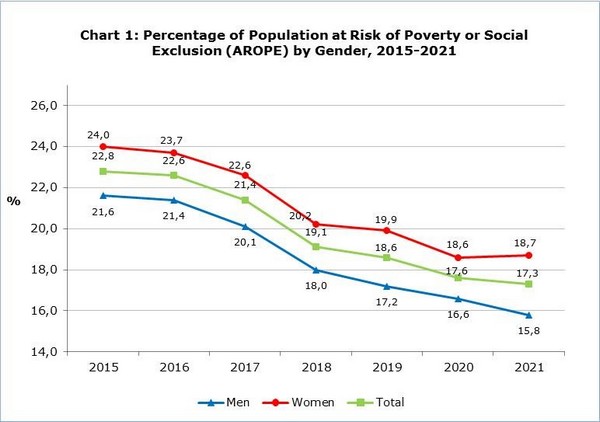
According to the results of the Survey on Income and Living Conditions 2021, with income reference period the year 2020, 17,3% of the population or 154.000 persons were at risk of poverty or social exclusion (AROPE indicator, the main indicator to monitor the EU 2030 target on poverty and social exclusion). Namely, 17,3% of the population was living in households whose disposable income was below the at-risk-of-poverty threshold or was severely materially and socially deprived or was living in households with very low work intensity. This indicator exhibited a minor improvement in comparison with the previous year when it stood at 17,6%, continuing its downward trend of the recent years. This improvement is reflected exclusively in the percentage of men (15,8%), as the percentage of women remained almost at the same level (18.7%) as the previous year. Throughout the years, women are maintaining their unfavorable position in respect to men. Chart 1 shows the evolution of this indicator in the years 2015 to 2021.
At-Risk-of-Poverty Indicator (AROP)
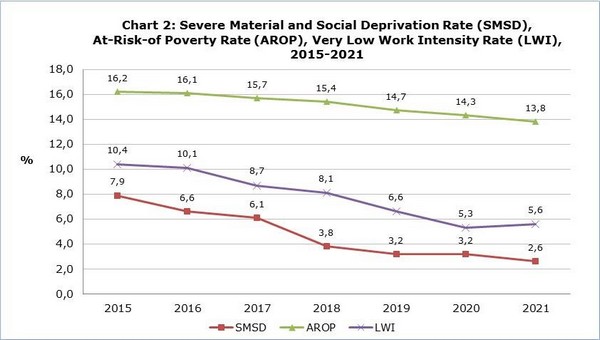
The percentage of the population that was at risk of poverty, meaning that its disposable income was below the at-risk-of-poverty threshold, exhibited a slight decrease, reaching 13,8% in respect to 14,3% that was in 2020. The highest percentage that this indicator has ever reached was 16,2% in 2015. The at-risk-of-poverty threshold remained nearly unchanged between the years 2021 and 2020, reaching €10.011 for single person households in 2021 compared to €10.022 in 2020 and to €21.024 for households with 2 adults and 2 dependent children compared to €21.047 in 2020.
Severe Material and Social Deprivation Indicator (SMSD)
The percentage of the population that was severely materially and socially deprived, meaning that they were experiencing enforced lack of at least 7 out of 13 deprivation items (7 related to the household and 6 to the individual), has decreased to 2,6% in 2021 in comparison to 3,2% in 2020. At the household level, the deprivation refers to the financial inability of household to face unexpected expenses, to pay rent or utility bills or loans, to keep home adequately warm, etc., while at the individual level to the financial inability of the individual to spend a small amount of money each week on him/herself, to have regular leisure activities, to get together with friends/family for a drink/meal at least once a month, etc. (more information in the definitions in the methodological part).
Very Low Work Intensity Indicator (LWI)
The percentage of the population aged 0-64 years, that was living in households with very low work intensity, meaning that the adults in the household worked less than 20% of their work potential during the past year, showed a minor increase in 2021, reaching 5,6% in comparison to 5,3% in 2020.
In Chart 2 that follows, each of the three indicators contributing to the computation of the strategic indicator at-risk-of-poverty or social exclusion is presented separately.
Income Inequality
The mean annual disposable income of the household for 2021, with income reference period the year 2020, was €34.227, exhibiting an increase of 1,1% in respect to that of the previous year, which was €33.862.
Income inequality is mainly described by the indicators on income distribution in quintiles, S80/S20 and the income inequality coefficient Gini. In 2021, these indicators remained almost at the same level in relation to the previous year. Specifically, the ratio S80/S20, which examines the income share of the 20% richer population to that of the 20% poorer population, reached 4,2 units in 2021. Namely, the income share of the 20% richer population was 4,2 times higher than the income share of the 20% poorer population in comparison with 4,3 in 2020. Additionally, the Gini coefficient reached 29,4%, in relation to 29,3% in 2020.
|
Table |
|
||||||
|
Indicator |
2015 |
2018 |
2019 |
2020 |
2021 |
||
|
At-risk-of-poverty or social exclusion rate (AROPE) |
Total |
% |
22,8 |
19,1 |
18,6 |
17,6 |
17,3 |
|
Men |
% |
21,6 |
18,0 |
17,2 |
16,6 |
15,8 |
|
|
Women |
% |
24,0 |
20,2 |
19,9 |
18,6 |
18,7 |
|
|
|
|||||||
|
At-risk-of-poverty threshold |
1 person households |
€ |
8.276 |
9.202 |
9.729 |
10.022 |
10.011 |
|
Households with 2 adults and 2 dependent children |
€ |
17.380 |
19.323 |
20.431 |
21.047 |
21.024 |
|
|
|
|
|
|
|
|
|
|
|
At-risk-of-poverty rate by age (AROP) |
Total |
% |
16,2 |
15,4 |
14,7 |
14,3 |
13,8 |
|
0-17 |
% |
16,7 |
17,3 |
16,7 |
16,1 |
15,8 |
|
|
18-64 |
% |
15,9 |
13,4 |
11,9 |
12,0 |
11,9 |
|
|
65+ |
% |
17,3 |
21,4 |
24,6 |
21,9 |
19,5 |
|
|
|
|||||||
|
Severe material and social deprivation (SMSD) |
Total |
% |
7,9 |
3,8 |
3,2 |
3,2 |
2,6 |
|
|
|||||||
|
Percentage of population aged 0-64 living in households with very low work intensity, by gender (LWI) |
Total |
% |
10,4 |
8,1 |
6,6 |
5,3 |
5,6 |
|
Men |
% |
9,9 |
7,9 |
6,1 |
5,1 |
5,3 |
|
|
Women |
% |
10,9 |
8,4 |
7,1 |
5,6 |
5,8 |
|
|
|
|
|
|
|
|
|
|
|
Mean annual disposable income of the household |
|
€ |
29.959 |
30.807 |
33.584 |
33.862 |
34.227 |
|
|
|
|
|
|
|
|
|
|
S80/S20 quintile share ratio |
|
5,2 |
4,3 |
4,6 |
4,3 |
4,2 |
|
|
|
|
|
|
|
|
|
|
|
Gini coefficient |
|
% |
33,6 |
29,1 |
31,1 |
29,3 |
29,4 |
Methodological information
Survey identity
The survey on Income and Living Conditions of the Households (EU-SILC) is conducted in accordance to Regulation (EC) No. 2019/1700 of the European Parliament and of the Council and is used by the European Statistical Service (EUROSTAT) as the main source of comparable information among the member states of the European Union (EU) on matters related to poverty and social exclusion.
The main objective of the survey is the study of various socio-economic indicators, which affect the living conditions of the population, the compilation of systematic statistics in relation to the income inequalities, the inequalities in living conditions of the households, poverty and social exclusion, as well as the compilation of structural social cohesion indicators.
Coverage and data collection
The survey conducted in 2021, with income reference period the year 2020, covered a sample of 4.113 households in all districts of Cyprus, in both urban and rural areas.
The survey is carried out since 2005 on an annual basis with a rotational sample and consists of two components, the cross-sectional and the longitudinal one. The cross-sectional refers to a point in time or period, whereas the longitudinal refers to the changes that arise on a personal level during a period of three to four years.
The data collection was carried out with personal and telephone interviews at the households using electronic questionnaires.
Definitions
At-risk-of-poverty or social exclusion rate (AROPE): At-risk-of-poverty or social exclusion rate is the percentage of the population who are: at risk of monetary poverty or severely materially and socially deprived or living in a household with a very low work intensity. Persons are only counted once even if they are present in several sub-indicators.
The indicator at-risk-of-poverty or social exclusion is the main indicator to monitor the EU 2030 target on poverty and social exclusion. The relevant target refers to the reduction of the number of people at risk of poverty or social exclusion by at least 15 million by 2030, and out of them, at least 5 million should be children.
At-risk-of-poverty threshold: is set at 60% of the national median equivalised disposable income, which is calculated by dividing the total disposable income of the household (total disposable income of all its members after social transfers) by the equivalised household size, which is calculated using the following weights: First adult=1,0 unit, second and each subsequent household member aged 14 years and over=0,5 and each household member aged under 14=0,3.
At-risk-of-poverty rate (AROP): The at-risk-of-poverty rate is the share of persons with an equivalised disposable income (after social transfers) below the at-risk-of-poverty threshold. It measures relative poverty and not absolute poverty.
Severe material and social deprivation (SMSD): Severely materially and socially deprived is the population who cannot afford a certain good, service or social activities. It refers to the population experiencing enforced lack of at least 7 out of 13 deprivation items (6 related to the individual and 7 related to the household):
At household level:
Cannot afford:
1) to face unexpected expenses,
2) a week holiday away from home,
3) to pay rent or utility bills or loans (to be confronted with payment arrears),
4) a meal with meat, chicken, fish or vegetarian equivalent every second day,
5) to keep home adequately warm,
6) to have a car/van for personal use,
7) to replace worn-out furniture.
At individual level:
Cannot afford:
1) to have an internet connection,
2) to replace worn-out clothes by some new ones,
3) to have two pairs of properly fitting shoes (including a pair of all-weather shoes),
4) to spend a small amount of money each week on him/herself,
5) to have regular leisure activities,
6) to get together with friends/family for a drink/meal at least once a month.
The six items at individual level are only collected for people aged 16 or over. For the children below 16 it is estimated by applying the rule: if at least half the number of adults in the household lack an item, then the children living in that household are considered deprived from that item as well.
Very low work intensity (LWI): The percentage of the population aged 0-64 that was living in households whose adults aged 18-64 worked less than 20% of their work potential during the past year. From the adults are excluded the students aged 18-24, people who are retired according to their self-defined current economic status or who receive any pension (except survivor’s pension), people in the age bracket 60-64 who are inactive and living in a household where the main income is pensions (except survivor’s pension).
Income distribution ratio, S80/S20: The income quintile share ratio or the S80/S20 ratio is calculated as the ratio of total equivalised disposable income received by the 20% of the population with the highest equivalised disposable income (the top quintile) to that received by the 20% of the population with the lowest equivalised disposable income (the bottom quintile).
Inequality of income distribution, Gini coefficient: Measure of (income) inequality or concentration. If incomes were equally distributed, the Gini coefficient would be 0. At the other extreme, if the richest unit received all income the Gini coefficient would be 100. An increase in the Gini coefficient thus represents an increase in inequality.
For more information visit theCYSTAT Portal, subtheme Living Conditions and Social Protection Predefined Tables (Excel) Methodological Information or contact Mr Charalambos Charalambous: tel:+35722602241, email: chcharalambous@cystat.mof.gov.cy
(EK/IK)
Relevant Press Releases
19-04-2024 16:42
PIO e-mail Αlerts service is suspended
18-04-2024 14:04
Price Index of Construction Materials: March 2024
17-04-2024 13:26
Harmonised Index of Consumer Prices (HICP): March 2024