Press Releases
27-01-2023 14:48
Imports, Sales and Stocks of Petroleum Products: December 2022
Annual change in sales -8,7 %
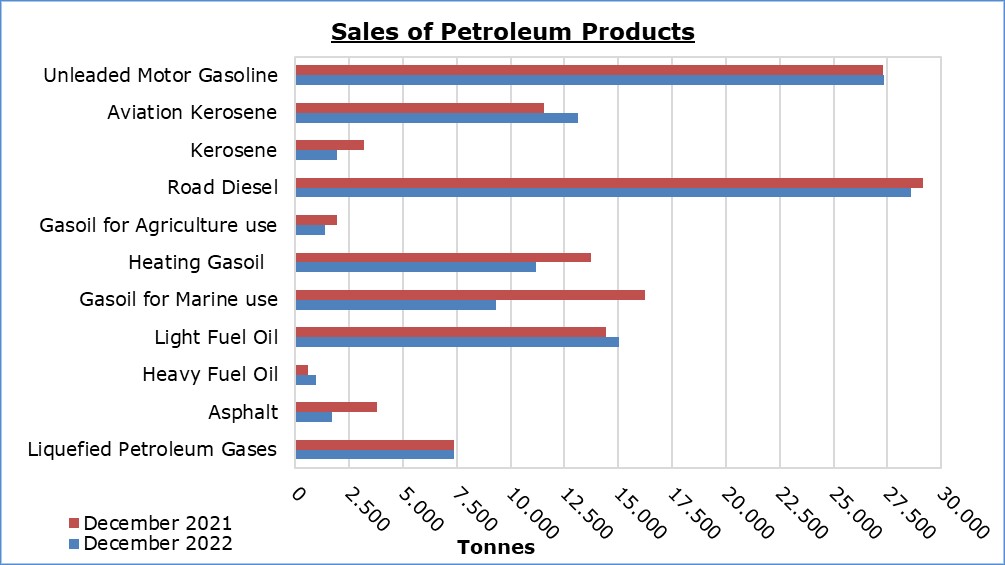
In December 2022, the total sales of petroleum products amounted to 118.203 tonnes, recording a decrease of 8,7% compared to December 2021. A decrease was observed in the provisions of marine gasoil (-42,5%) and in the sales of asphalt (-55,4%), kerosene (-39,9%), heating gasoil (-18,8%) and road diesel (-1,8%). On the contrary, a rise was recorded in the provisions of aviation kerosene (13,5%), as well as in the sales of heavy and light fuel oil (62,8% and 4,3% respectively) and motor gasoline (0,2%). As far as the sales from filling stations are specifically concerned, these have registered a fall of 7,5% to 59.381 tonnes.
The total sales of petroleum products in December 2022 compared to November 2022 recorded a rise of 2,8%. Indicatively, an increase was recorded in the sales of motor gasoline (7,5%) and road diesel (0,8%) while the provisions of aviation kerosene decreased (-15,0%). The total stocks of petroleum products at the end of December 2022 increased by 3,6% compared to the end of the previous month.
During the year 2022, the total sales of petroleum products increased by 9,9% compared to 2021. The provisions of aviation kerosene and marine gasoil rose by 67,7% and 8,0% respectively while an increase was also recorded in the sales of light fuel oil (13,8%), heating gasoil (12,4%), liquefied petroleum gases (10,3%) and motor gasoline (1,6%). On the contrary, a decrease was observed in the sales of asphalt (-26,5%) and road diesel (-4,0%). In 2022 the sales from filling stations reached 654.073 tonnes, recording a slight fall of 0,9% compared to 2021.
|
Table 1 |
|
|
|
|
|
|
|
|
Products |
Total Sales (tonnes) |
|
Percentage Change (%) |
||||
|
Dec 2022 |
Dec 2021
|
Jan - Dec 2022 |
Jan - Dec 2021 |
|
Dec 2022 / Dec 2021 |
Jan - Dec 2022 / Jan - Dec 2021 |
|
|
Unleaded Motor Gasoline |
27.353 |
27.310 |
310.130 |
305.371 |
|
0,2 |
1,6 |
|
Aviation Gasoline |
0 |
1 |
15 |
25 |
|
-100,0 |
-40,0 |
|
Aviation Kerosene |
13.118 |
11.555 |
255.725 |
152.510 |
|
13,5 |
67,7 |
|
Kerosene |
1.927 |
3.207 |
13.822 |
13.492 |
|
-39,9 |
2,4 |
|
Road Diesel |
28.612 |
29.146 |
331.140 |
345.047 |
|
-1,8 |
-4,0 |
|
Gasoil for Agriculture use |
1.400 |
1.947 |
22.787 |
24.328 |
|
-28,1 |
-6,3 |
|
Heating Gasoil |
11.174 |
13.756 |
93.448 |
83.117 |
|
-18,8 |
12,4 |
|
Gasoil for Marine use |
9.335 |
16.236 |
126.024 |
116.675 |
|
-42,5 |
8,0 |
|
Light Fuel Oil |
15.055 |
14.434 |
182.365 |
160.301 |
|
4,3 |
13,8 |
|
Heavy Fuel Oil |
946 |
581 |
10.112 |
9.501 |
|
62,8 |
6,4 |
|
Lubricants |
235 |
186 |
2.775 |
2.604 |
|
26,3 |
6,6 |
|
Asphalt |
1.694 |
3.795 |
31.067 |
42.289 |
|
-55,4 |
-26,5 |
|
Liquefied Petroleum Gases |
7.354 |
7.365 |
60.253 |
54.617 |
|
-0,1 |
10,3 |
|
Total |
118.203 |
129.519 |
1.439.663 |
1.309.877 |
|
-8,7 |
9,9 |
|
Table 2 |
|
|
|
|
|
|
|
|
Products |
Sales from Filling Stations (tonnes) |
|
Percentage Change (%) |
||||
|
Dec 2022 |
Dec 2021
|
Jan - Dec 2022 |
Jan - Dec 2021 |
|
Dec 2022 / Dec 2021 |
Jan - Dec 2022 / Jan - Dec 2021 |
|
|
Unleaded Motor Gasoline |
27.075 |
26.963 |
306.281 |
300.817 |
|
0,4 |
1,8 |
|
Kerosene |
1.457 |
2.519 |
10.658 |
10.444 |
|
-42,2 |
2,0 |
|
Road Diesel |
22.678 |
23.793 |
263.024 |
276.579 |
|
-4,7 |
-4,9 |
|
Gasoil for Agriculture use |
944 |
1.386 |
15.523 |
17.162 |
|
-31,9 |
-9,6 |
|
Heating Gasoil |
7.112 |
9.421 |
57.045 |
53.360 |
|
-24,5 |
6,9 |
|
Light Fuel Oil |
39 |
54 |
457 |
459 |
|
-27,8 |
-0,4 |
|
Lubricants |
76 |
81 |
1.085 |
1.042 |
|
-6,2 |
4,1 |
|
Total
|
59.381 |
64.217 |
654.073 |
659.863 |
|
-7,5 |
-0,9 |
METHODOLOGICAL INFORMATION
Scope and Coverage
The collection of data on Imports, Sales and Stocks of Petroleum Products is carried out on a monthly basis.
It concerns the sales of petroleum products from filling stations and the sales to government departments, to the British Bases and the United Nations, to ships and to other customers, as well as the stocks held at the end of each month. Only the petroleum companies are being covered. Additionally, the imports of petroleum products imported directly from the Electricity Authority of Cyprus (EAC) and the manufacturing industry are also included.
Data collection
The collection of data is conducted by the Statistical Service on a monthly basis by electronically receiving a purpose-designed questionnaire from each of these companies.
For more information:
CYSTAT Portal, subtheme Energy
CYSTAT-DB (Online Database)
Predefined Tables (Excel)
Contact
Nafsika Apostolou: Tel.: +35722602199, E-mail: napostolou@cystat.mof.gov.cy
(MG/ECHR)
Relevant Press Releases
26-07-2024 16:44
Imports, Sales and Stocks of Petroleum Products: June 2024

18-07-2024 13:34
Price Index of Construction Materials: June 2024
17-07-2024 19:17
Harmonized Index of Consumer Prices (HICP): June 2024