Press Releases
28-03-2024 14:27
Industrial Production Index: January 2024
Annual Change +4,2%
In January 2024, the Industrial Production Index reached 99,5 units (base 2021=100), recording an increase of 4,2% compared to January 2023.
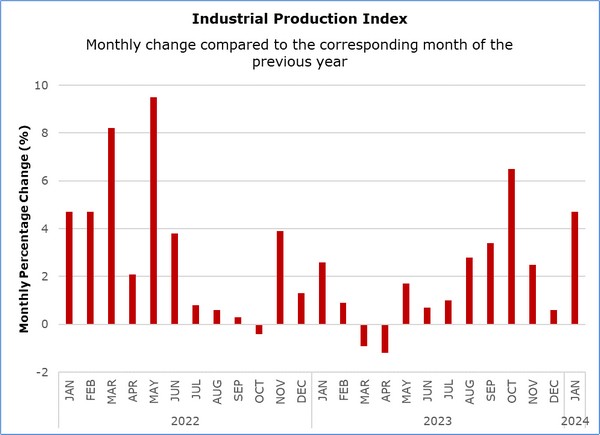
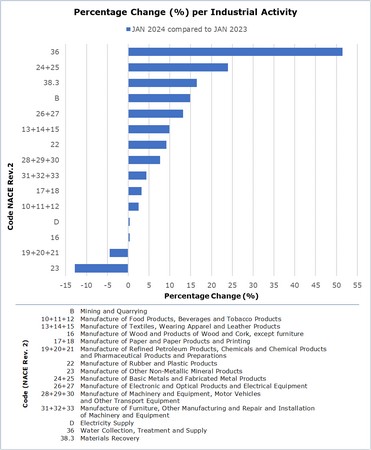
The manufacturing sector registered an increase of 3,2% compared to January 2023. An increase was also observed in the sectors of water supply and materials recovery (+33,8%), mining and quarrying (+14,8%) and electricity supply (+0,4%).
In the manufacturing sector, the most significant positive changes compared to January 2023 were observed in the manufacturing of basic metals and fabricated metal products (+24,0%), electronic and optical products and electrical equipment (+13,2%), textiles, wearing apparel and leather products (+9,9%), rubber and plastic products (+9,2%) and machinery and equipment, motor vehicles and other transport equipment (+7,6%). The only negative changes were observed in the manufacturing of other non-metallic mineral products (-12,8%) and the manufacturing of refined petroleum products, chemicals and chemical products and pharmaceutical products and preparations (-4,5%).
|
Table |
||||
|
Code (NACE Rev. 2) |
Economic Activity |
Index (2021=100) |
Percentage Change (%) |
|
|
Jan 2024 |
Jan 2024/2023 |
Jan-Dec 2023/2022 |
||
|
Β |
Mining and Quarrying |
110,7 |
14,8 |
6,4 |
|
C |
Μanufacturing |
98,2 |
3,2 |
1,9 |
|
10+11+12 |
Manufacture of Food Products, Beverages and Tobacco Products |
95,2 |
2,5 |
1,0 |
|
13+14+15 |
Manufacture of Textiles, Wearing Apparel and Leather Products |
102,1 |
9,9 |
10,1 |
|
16 |
Manufacture of Wood and Products of Wood and Cork, except furniture |
92,1 |
0,3 |
1,5 |
|
17+18 |
Manufacture of Paper and Paper Products and Printing |
87,8 |
3,2 |
-8,2 |
|
19+20+21 |
Manufacture of Refined Petroleum Products, Chemicals and Chemical Products and Pharmaceutical Products and Preparations |
111,0 |
-4,5 |
1,4 |
|
22 |
Manufacture of Rubber and Plastic Products |
97,2 |
9,2 |
-0,1 |
|
23 |
Manufacture of Other Non-Metallic Mineral Products |
87,9 |
-12,8 |
0,3 |
|
24+25 |
Manufacture of Basic Metals and Fabricated Metal Products |
107,0 |
24,0 |
9,7 |
|
26+27 |
Manufacture of Electronic and Optical Products and Electrical Equipment |
73,8 |
13,2 |
30,9 |
|
28+29+30 |
Manufacture of Machinery and Equipment, Motor Vehicles and Other Transport Equipment |
104,2 |
7,6 |
16,1 |
|
31+32+33 |
Manufacture of Furniture, Other Manufacturing and Repair and Installation of Machinery and Equipment |
104,9 |
4,4 |
-6,8 |
|
D |
Electricity Supply |
99,9 |
0,4 |
-1,3 |
|
Ε |
Water Supply and Materials Recovery |
116,8 |
33,8 |
5,3 |
|
36 |
Water Collection, Treatment and Supply |
126,6 |
51,4 |
9,6 |
|
38.3 |
Materials Recovery |
106,2 |
16,4 |
0,5 |
|
B+C+D+E |
General Index |
99,5 |
4,2 |
1,7 |
Methodological Information
Scope
The Industrial Production Index reflects the monthly changes of the volume of production in the sectors of mining and quarrying, manufacturing, electricity supply, water supply and materials recovery, that is, sections B, C, D and E of the statistical classification of economic activities NACE Rev. 2 of the European Union. The index does not include sewerage, waste collection, treatment and disposal and remediation activities, which are codes 37, 38.1, 38.2 and 39 of section E.
Data Collection
The collection of data is conducted by the Statistical Service by telephone enquiries, fax or e-mail. The data collection process starts five to ten days after the end of the reference period and is normally completed within a month and a half. The mining and quarrying sector covers all major quarrying products but not the support activities for the extraction of natural gas. For manufacturing, all enterprises with production value 2.000.000 Euros and over or with 20 or more employees are included in the survey and a sample is selected from enterprises employing less than 20 persons. For electricity supply and water collection, treatment and supply, data is collected from administrative sources.
Compilation Methods and Dissemination Practices
The Industrial Production Index is using 2021 as base year, meaning that it shows the monthly changes in production in relation with the monthly average production of the year 2021. In the base year, the average of the production indices for the twelve months is 100,0. For example, a monthly production index of 103,4 means that the production for the specific month has increased by 3,4% in relation to the monthly average production of 2021.
The aggregated Index of Industrial Production is a weighted average of the production indices of the various sub-sectors of Industry, as determined in the statistical classification of economic activities NACE Rev. 2. The weights used for the compilation of the index are derived from the value added of the enterprises in the base year (2021) and reflect the value added of each sub-sector in relation to the total value added of the Industrial sector.
The compilation of the Industrial Production Index follows the provisions of Regulation (EU) 2019/2152 on European business statistics. In addition to gross data, both seasonally and working day adjusted data are transmitted every month to the Statistical Office of the European Union (Eurostat). The Index is published at national level only in its gross form.
For more information, visit the CYSTAT Portal, subtheme Industry, Information on Change of Base Year, CYSTAT-DB (Online Database), Predefined Tables (Excel), or contact Ms Elisavet Zinonos, at 22602187 or via e-mail at ezinonos@cystat.mof.gov.cy, and Mr Charalambos Alkiviadous, at 22602189 or via e-mail at calkiviadous@cystat.mof.gov.cy.
Data for base year 2021=100 are available only in the CYSTAT-DB Online Database.
(MS/NZ)
Relevant Press Releases
26-07-2024 16:44
Imports, Sales and Stocks of Petroleum Products: June 2024

18-07-2024 13:34
Price Index of Construction Materials: June 2024
17-07-2024 19:17
Harmonized Index of Consumer Prices (HICP): June 2024